It’s official. Palgrave/MacMillan has accepted my next book, Disability Servitude: From Peonage to Poverty for publication!
Here’s a bit of the overview:
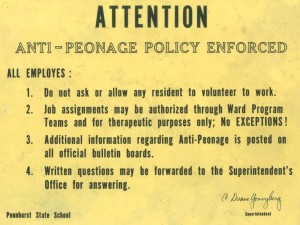
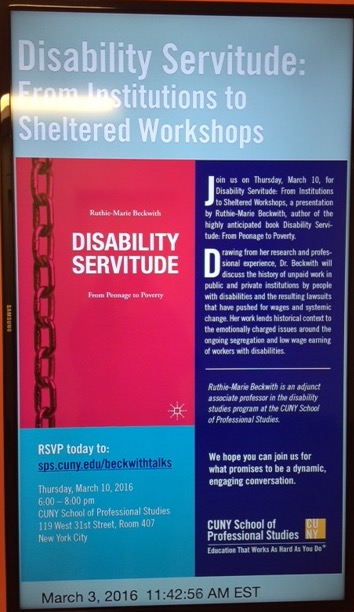
For well over a century, institutional peonage held individuals with intellectual, along with a host of other disabilities, in thrall to the maintenance and operation of the nation’s public institutions. By 1972, residents accounted for 47,000 workers in the institutions for individuals with intellectual disabilities alone. Resident workers shoveled coal; labored in the fields; worked in the laundry; cooked and served meals in the dining halls; scrubbed and cleaned throughout the facilities; and provided direct care for fellow residents. Resident workers drove tractors, ran machinery, and even fought forest fires. They did all these things and more—all unpaid—an invisible workforce that labored for ten to twelve hours a day, seven days a week. Five years later, it all came to a grinding halt.
Beginning in the early 1970s, residents in institutional settings from across the country brought a number of lawsuits with Thirteenth Amendment claims—asserting their right to be free from involuntary servitude. The Peonage Cases, along with a number of other significant legislative and litigation efforts, set the field on a new course of normalization and the expansion of community based services. In 1974, in the matter of Souder v. Brennan, the Federal District Court in D. C. ruled that, for the first time, the Fair Labor Standards Act as amended in 1966 applied to hospitals, including the public institutions. This meant that, for the first time, resident workers were to be paid minimum wage for the labor they performed.
Instead, states opted to cease their work programs and replace the resident workers with other non-disabled paid employees.
My final revised version is due on May 15th along with a permission to use an abundance of quotes from current and historical references. I’m also teaching two Disability History classes for CUNY this spring. And, there always weaving to take into consideration. But, it does looks like I will be chained to my laptop for some time to come.
Sigh. I’ll keep you posted on how it’s all coming along now that I’ve got my website access straightened back out.
rb

 FOR IMMEDIATE RELEASE: (February 13, 2016)